FORECASTING LOST SALES
The Carlson Department Store suffered heavy damage when a
hurricane struck on August 31, 2000. The store was closed for four
months (September 2000 through December 2000), and Carlson is now
involved in a dispute with its insurance company about the amount
of lost sales during the time the store was closed. Two key issues
must be resolved: (1) the amount of sales Carlson would have made
if the hurricane had not struck and (2) whether Carlson is entitled
to any compensation for excess sales due to increased business
activity after the storm. More than $8 billion in federal disaster
relief and insurance money came into the county, resulting in
increased sales at department stores and numerous other businesses.
Table 1 gives Carlson’s sales data for the 48 months preceding the
storm. Table 2 reports total sales for the 48 months preceding the
storm for all department stores in the county, as well as the total
sales in the county for the four months the Carlson Department
Store was closed. Carlson’s managers have asked you to analyze
these data and develop estimates of the lost sales at the Carlson
Department Store for the months of September through December 2000.
They also have asked you to determine whether a case can be made
for excess storm-related sales during the same period. If such a
case can be made, Carlson is entitled to compensation for excess
sales it would have earned in addition to ordinary sales.
Table1. Carlson’s Sales.
Table 2. Department Store Sales.
Managerial Report.
Prepare a report for the managers of the Carlson Department
Store that summarizes your findings, forecasts, and
recommendations. Include:
1. An estimate of sales had there been no hurricane.
2. An estimate of countywide department store sales had there
been no hurricane.
3. An estimate of lost sales for the Carlson Department Store
for September through December 2000.
In addition, use the countywide actual department stores sales
for September through: December 2000 and the estimate in part (2)
to make a case for or against excess storm related sales.
Expert Answer
![]() Ramjakhar
Ramjakhar
answered this
Was this answer helpful?
3
0
9,671 answers
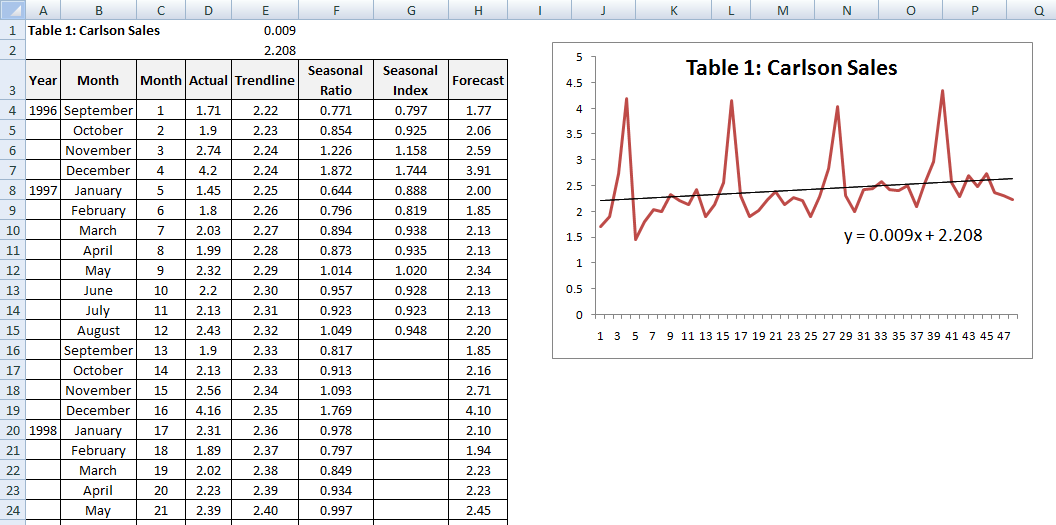
1. As we see, there’s seasonality in the data, so we will use
time series decomposition method to forecast the sales of Carlson
Stores and that of Countrywide Dept Stores during the 4 months
period.
Steps involved in Time Series decomposition method are as
below
Step 1: Organize the data in a series from month 1 to 48. Plot
the data on a graph and also plot the linear regression trend line
and display trendline equation on chart.
Step 2: Calculate trendline for each month as per the equation
displayed on chart (y = ax + b) , where a is the slope and b is
intercept
Step 3: Calculate Seasonal Ratio by dividing actual sales by
trendline
Step 4: Calculate Seasonal index for each of the 12 months by
averaging the seasonal ratio of the corresponding months. For
example, to determine seasonal index for January, calculate the
average of the seasonal ratio of Janurary months of all the years.
Please note there will be only 12 seasonal indices for the month
September to August.
Step 5: Calculate Forecast Sales by multiplying the trendline
with the Seasonal index for corresponding month.
Estimate of Carlson sales had there been no hurricane
from September to December is 2.11, 2.46, 3.09, 4.67
| Table 1: Carlson Sales |
0.009 | ||||||
| 2.208 | |||||||
| Year | Month | Month | Actual | Trendline | Seasonal Ratio | Seasonal Index | Forecast |
| 1996 | September | 1 | 1.71 | 2.22 | 0.771 | 0.797 | 1.77 |
| October | 2 | 1.9 | 2.23 | 0.854 | 0.925 | 2.06 | |
| November | 3 | 2.74 | 2.24 | 1.226 | 1.158 | 2.59 | |
| December | 4 | 4.2 | 2.24 | 1.872 | 1.744 | 3.91 | |
| 1997 | January | 5 | 1.45 | 2.25 | 0.644 | 0.888 | 2.00 |
| February | 6 | 1.8 | 2.26 | 0.796 | 0.819 | 1.85 | |
| March | 7 | 2.03 | 2.27 | 0.894 | 0.938 | 2.13 | |
| April | 8 | 1.99 | 2.28 | 0.873 | 0.935 | 2.13 | |
| May | 9 | 2.32 | 2.29 | 1.014 | 1.020 | 2.34 | |
| June | 10 | 2.2 | 2.30 | 0.957 | 0.928 | 2.13 | |
| July | 11 | 2.13 | 2.31 | 0.923 | 0.923 | 2.13 | |
| August | 12 | 2.43 | 2.32 | 1.049 | 0.948 | 2.20 | |
| September | 13 | 1.9 | 2.33 | 0.817 | 1.85 | ||
| October | 14 | 2.13 | 2.33 | 0.913 | 2.16 | ||
| November | 15 | 2.56 | 2.34 | 1.093 | 2.71 | ||
| December | 16 | 4.16 | 2.35 | 1.769 | 4.10 | ||
| 1998 | January | 17 | 2.31 | 2.36 | 0.978 | 2.10 | |
| February | 18 | 1.89 | 2.37 | 0.797 | 1.94 | ||
| March | 19 | 2.02 | 2.38 | 0.849 | 2.23 | ||
| April | 20 | 2.23 | 2.39 | 0.934 | 2.23 | ||
| May | 21 | 2.39 | 2.40 | 0.997 | 2.45 | ||
| June | 22 | 2.14 | 2.41 | 0.889 | 2.23 | ||
| July | 23 | 2.27 | 2.42 | 0.940 | 2.23 | ||
| August | 24 | 2.21 | 2.42 | 0.912 | 2.30 | ||
| September | 25 | 1.89 | 2.43 | 0.777 | 1.94 | ||
| October | 26 | 2.29 | 2.44 | 0.938 | 2.26 | ||
| November | 27 | 2.83 | 2.45 | 1.155 | 2.84 | ||
| December | 28 | 4.04 | 2.46 | 1.642 | 4.29 | ||
| 1999 | January | 29 | 2.31 | 2.47 | 0.936 | 2.19 | |
| February | 30 | 1.99 | 2.48 | 0.803 | 2.03 | ||
| March | 31 | 2.42 | 2.49 | 0.973 | 2.33 | ||
| April | 32 | 2.45 | 2.50 | 0.982 | 2.33 | ||
| May | 33 | 2.57 | 2.51 | 1.026 | 2.56 | ||
| June | 34 | 2.42 | 2.51 | 0.963 | 2.33 | ||
| July | 35 | 2.4 | 2.52 | 0.951 | 2.33 | ||
| August | 36 | 2.5 | 2.53 | 0.987 | 2.40 | ||
| September | 37 | 2.09 | 2.54 | 0.823 | 2.03 | ||
| October | 38 | 2.54 | 2.55 | 0.996 | 2.36 | ||
| November | 39 | 2.97 | 2.56 | 1.161 | 2.96 | ||
| December | 40 | 4.35 | 2.57 | 1.694 | 4.48 | ||
| 2000 | January | 41 | 2.56 | 2.58 | 0.993 | 2.29 | |
| February | 42 | 2.28 | 2.59 | 0.882 | 2.12 | ||
| March | 43 | 2.69 | 2.60 | 1.037 | 2.43 | ||
| April | 44 | 2.48 | 2.60 | 0.952 | 2.44 | ||
| May | 45 | 2.73 | 2.61 | 1.045 | 2.67 | ||
| June | 46 | 2.37 | 2.62 | 0.904 | 2.43 | ||
| July | 47 | 2.31 | 2.63 | 0.878 | 2.43 | ||
| August | 48 | 2.23 | 2.64 | 0.845 | 2.50 | ||
| 2000 | September | 49 | 2.65 | 2.11 | |||
| October | 50 | 2.66 | 2.46 | ||||
| November | 51 | 2.67 | 3.09 | ||||
| December | 52 | 2.68 | 4.67 | ||||
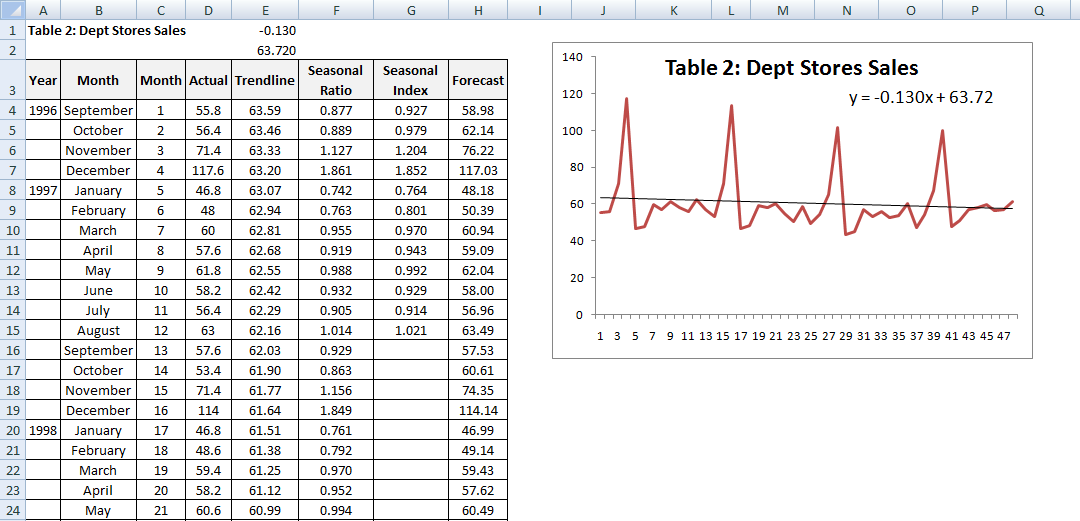
2. Using the same method (time Series
Decomposition) as used in part (1) , calculate the forecast sales
of Department Stores.
An estimate of countywide department store sales had there been
no hurricane from September to December 2000 = 53.19 + 56.03 +
68.71 + 105.47 = 283.41
| Table 2: Dept Stores Sales |
-0.130 | ||||||
| 63.720 | |||||||
| Year | Month | Month | Actual | Trendline | Seasonal Ratio | Seasonal Index | Forecast |
| 1996 | September | 1 | 55.8 | 63.59 | 0.877 | 0.927 | 58.98 |
| October | 2 | 56.4 | 63.46 | 0.889 | 0.979 | 62.14 | |
| November | 3 | 71.4 | 63.33 | 1.127 | 1.204 | 76.22 | |
| December | 4 | 117.6 | 63.20 | 1.861 | 1.852 | 117.03 | |
| 1997 | January | 5 | 46.8 | 63.07 | 0.742 | 0.764 | 48.18 |
| February | 6 | 48 | 62.94 | 0.763 | 0.801 | 50.39 | |
| March | 7 | 60 | 62.81 | 0.955 | 0.970 | 60.94 | |